
I think the “health of our applications” topic has always been an important and common concern for all of us regardless of the architectural approach.
As we know, to make our applications health status visible or to learn it in easy way minimizes the risk of application in many situations.
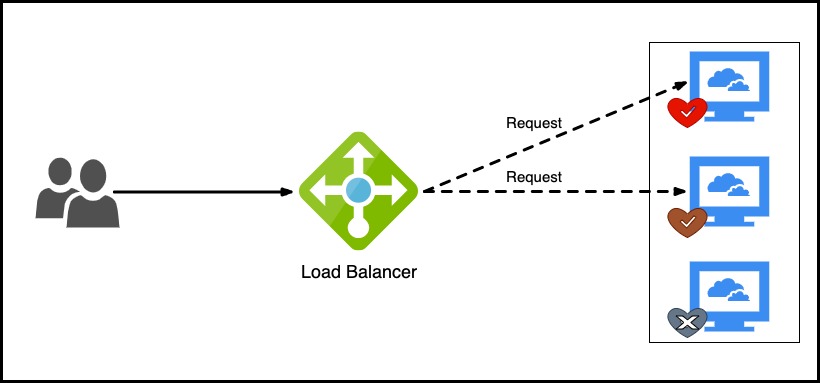
Especially if our applications are running as multi instance behind of the load-balancer, we need to inform the load-balancer with health check endpoints to which instances the traffic should be sent during the process of routing the traffic or updating the application to a new version. Thus, we can ensure that the traffic will not send to an instance that has not started working yet with all its depencencies.
For example, if we want to orchestrate our microservices with kubernetes, we need to define health check endpoint of the application in the rediness probe of the container in order for kubernetes to decide whether the container is ready to accept traffic.
In this article, I will try to mention about the health checks feature, that has been offered to us as build-in since ASP.NET Core 2.2, and also how can we integrate it with Azure Application Insights.
ASP.NET Core Health Checks is a great feature that allows us to define health checks by taking into account the dependencies of the application such as “Sql Server“, “MySql“, “Oracle“, “Mongo“, “RabbitMQ” or “Elasticsearch“.
Let’s write some code.
Implementation of ASP.NET Core Health Checks
First, let’s create an ASP.NET Core 3.1 Web API project as following.
dotnet new webapi -n Todo
Then we need to add the “Microsoft.AspNetCore.Diagnostics.HealthChecks” package to the project via NuGet.
dotnet add package Microsoft.AspNetCore.Diagnostics.HealthChecks
Let’s suppose that this API is a microservice that uses MongoDB as a data source.
To do this, let’s quickly get a MongoDB instance on Docker by using the below command line.
docker run -d --name my-mongo -p 27017:27017 mongo
After having the MongoDB instance, let’s add the “AspNetCore.HealthChecks.MongoDb” package to the project via NuGet in order to see health of the MongoDB.
Now let’s go to the “Startup” class of the API and configure the health checks service in the “ConfigureServices” method as follows.
public void ConfigureServices(IServiceCollection services)
{
    services.AddControllers();

    string mongoDBConnection = Configuration.GetValue("mongoDB:connection");

    services.AddHealthChecks()
            .AddMongoDb(mongodbConnectionString: mongoDBConnection,
            name: "todo-db-check",
            failureStatus: HealthStatus.Unhealthy,
            tags: new string[] { "todo-api", "mongodb" });
}
If we look at the above code block, we can see that we have had a health check definition for MongoDB easily.
We also need to add connection string info for MongoDB in the app settings file as follows.
"mongoDB:connection": "mongodb://localhost:27017"
Now, let’s add the health check with “/hc” path to the request pipeline as follows.
app.UseEndpoints(endpoints =>
{
    endpoints.MapControllers();
    endpoints.MapHealthChecks("/hc");
});
Then, in order to perform our first test, let’s run the API and hit the “/hc” endpoint via browser.
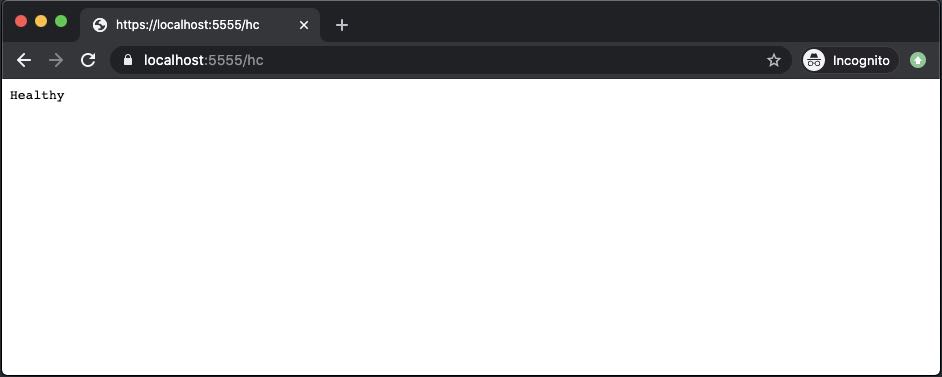
As we can see the API is in healthy status with its database.
Output of the health check is “text/plain” by default. Therefore, we only see a response such as “Healthy” or “Unhealthy“. In order to see a detailed health check output with all dependencies, we need to customize it via “ResponseWriter” property, which takes place in the “HealthCheckOptions“, when adding health check to the request pipeline.
In order not to write a custom code, we can use the “WriteHealthCheckUIResponse” writer that comes with the “AspNetCore.HealthChecks.UI.Client” package.
To do this, first let’s include the “AspNetCore.HealthChecks.UI” package via NuGet. After that, let’s configure the health check.
app.UseEndpoints(endpoints =>
{
    endpoints.MapControllers();
    endpoints.MapHealthChecks("/hc", new HealthCheckOptions()
    {
        Predicate = _ => true,
        ResponseWriter = UIResponseWriter.WriteHealthCheckUIResponse
    });
});
Now let’s run the API again and hit the “/hc” endpoint via browser.

As we can see, now we have a more detailed health check output.
Let’s Implement Our Custom Health Check
Well, we have used the “AspNetCore.HealthChecks.MongoDb” package to see the health status of the MongoDB.
NOTE: You can access all available health checks list here.
What if we have a custom need? In case of such situations, it is possible to create our own health checks by implementing the “IHealthCheck” interface.
Let’s do a quick example. To do this, we need to create a class called “TodoHealthCheck” and implement it as follows.
using System.Threading;
using System.Threading.Tasks;
using Microsoft.Extensions.Diagnostics.HealthChecks;

namespace dotnetcore_healthchecks_sample
{
    public class TodoHealthCheck : IHealthCheck
    {
        public Task CheckHealthAsync(HealthCheckContext context, CancellationToken cancellationToken = default)
        {
            // ...

            return Task.FromResult(HealthCheckResult.Healthy());
        }
    }
}
Then, let’s include it in the health checks service as follows.
services.AddHealthChecks()
        .AddMongoDb(mongodbConnectionString: mongoDBConnection,
        name: "todo-db-check",
        failureStatus: HealthStatus.Unhealthy,
        tags: new string[] { "todo-api", "mongodb" })
        .AddCheck("todo-custom-check");
That’s all. Now let’s hit one more time to the “/hc” endpoint via browser.
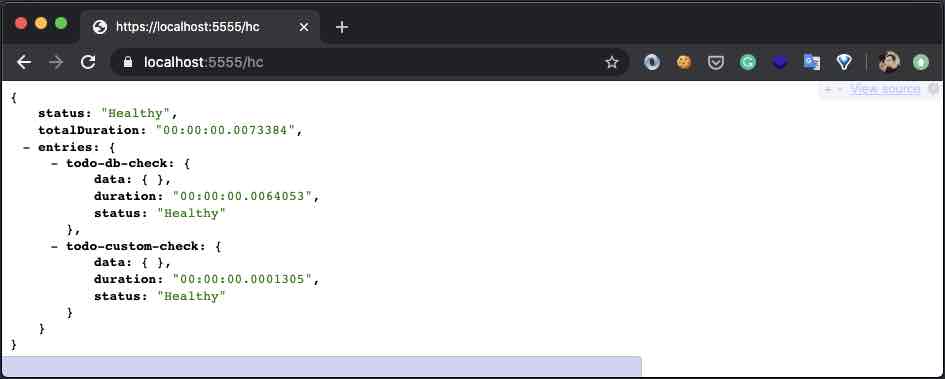
As we can see, the custom health check, that we have created, is included in the health check output with the name “todo-custom-check“.
Let’s Visualize It
There is a very fancy UI for us to visualize the health check output. To use this, we need to include the “AspNetCore.HealthChecks.UI” package to the project via NuGet.
In the previous step, we have already included this package in the project to get a detailed health check output. Now we need to configure it to enable it.
First, let’s add the UI to the service collection as follows.
services.AddHealthChecksUI(setupSettings: setup =>
{
    setup.AddHealthCheckEndpoint("Todo API", "https://localhost:5555/hc");
});
Then let’s add it to the request pipeline using the “MapHealthChecksUI” method as follows.
app.UseEndpoints(endpoints =>
{
    endpoints.MapControllers();
    endpoints.MapHealthChecks("/hc", new HealthCheckOptions()
    {
        Predicate = _ => true,
        ResponseWriter = UIResponseWriter.WriteHealthCheckUIResponse
    });
    endpoints.MapHealthChecksUI();
});
The Health Check UI endpoint comes by default as “/healthchecks-ui“. If you wish, you can change this value by customizing it through the “MapHealthChecksUI” method.
Now to test it, let’s hit the “/healthchecks-ui” endpoint via browser.
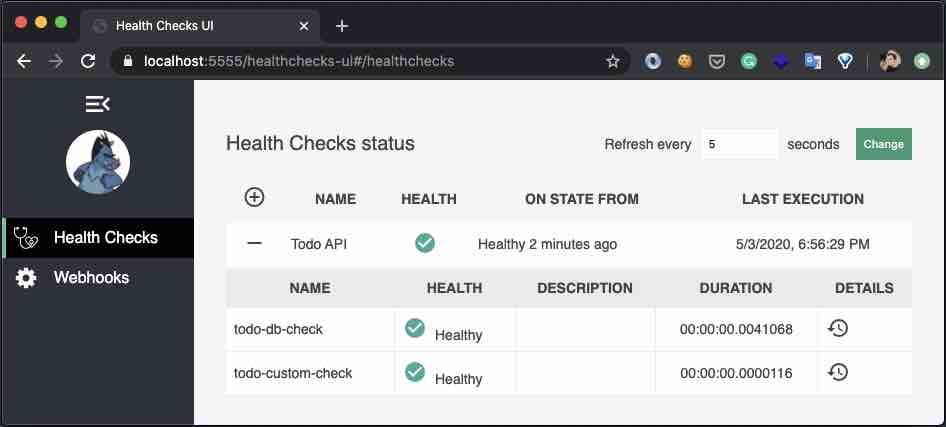
It is possible to see the health status of the application and its dependencies easily through the UI. It is also possible to persist the relevant health check outputs by adding a storage provider for the UI. You can access the list of providers here.
Integrating with Azure Application Insight
If you are also hosting your applications on Azure, sending health check outputs to Azure Application Insight would be a good option.
Thus, we can prepare special charts for availability of our applications and also generate alerts in case of any errors.
So, to do this, let’s include the “AspNetcore.HealthChecks.Publisher.ApplicationInsights” package to the project via NuGet.
NOTE: If you don’t have any Azure Application Insight service, you can create it from here.
After including the package, let’s add the Application Insights publisher to the health checks service as follows.
string instrumentationKey = Configuration.GetValue("azure:instrumentationKey");

services.AddHealthChecks()
        .AddMongoDb(mongodbConnectionString: mongoDBConnection,
        name: "todo-db-check",
        failureStatus: HealthStatus.Unhealthy,
        tags: new string[] { "todo-api", "mongodb" })
        .AddCheck("todo-custom-check")
        .AddApplicationInsightsPublisher(instrumentationKey: instrumentationKey);
Now we need to add the “instrumentationKey” information of the Application Insights, which we can find through the Azure Portal, to the app settings file of the API.
That’s all.
Let’s run the API and then stop the instance of the MongoDB which we have had before on the Docker.
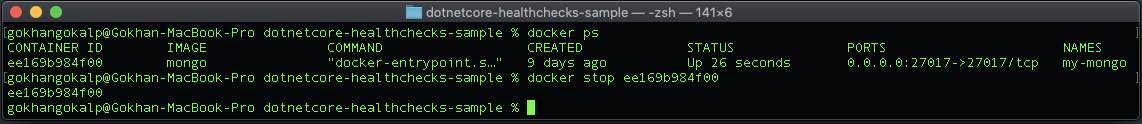
When we hit the “/hc” endpoint via the browser, we should be able to see an output like below.
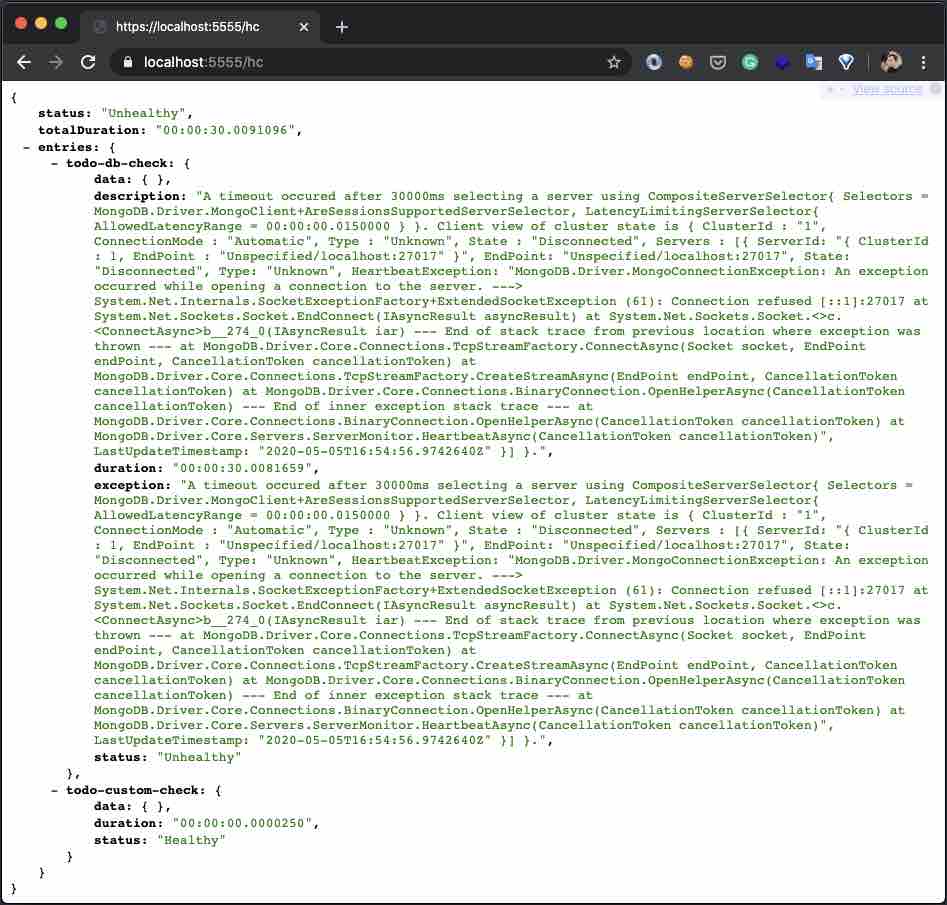
As we can see, since the status of the “todo-db-check” is “Unhealthy“, the overall status of the API is “Unhealthy“.
Now let’s go to the relevant Application Insights instance via Azure Portal, and then click on the “Metrics” tab under the “Monitoring” tab.
After going to “Metrics” tab, we need to select filters. To do that, let’s select the “Metric Namespace” filter as “azure.applicationinsights” and “Metric” filter as “AspNetCoreHealthCheckStatus“. Thus, we will be able to visualize the availability of the API as follows.
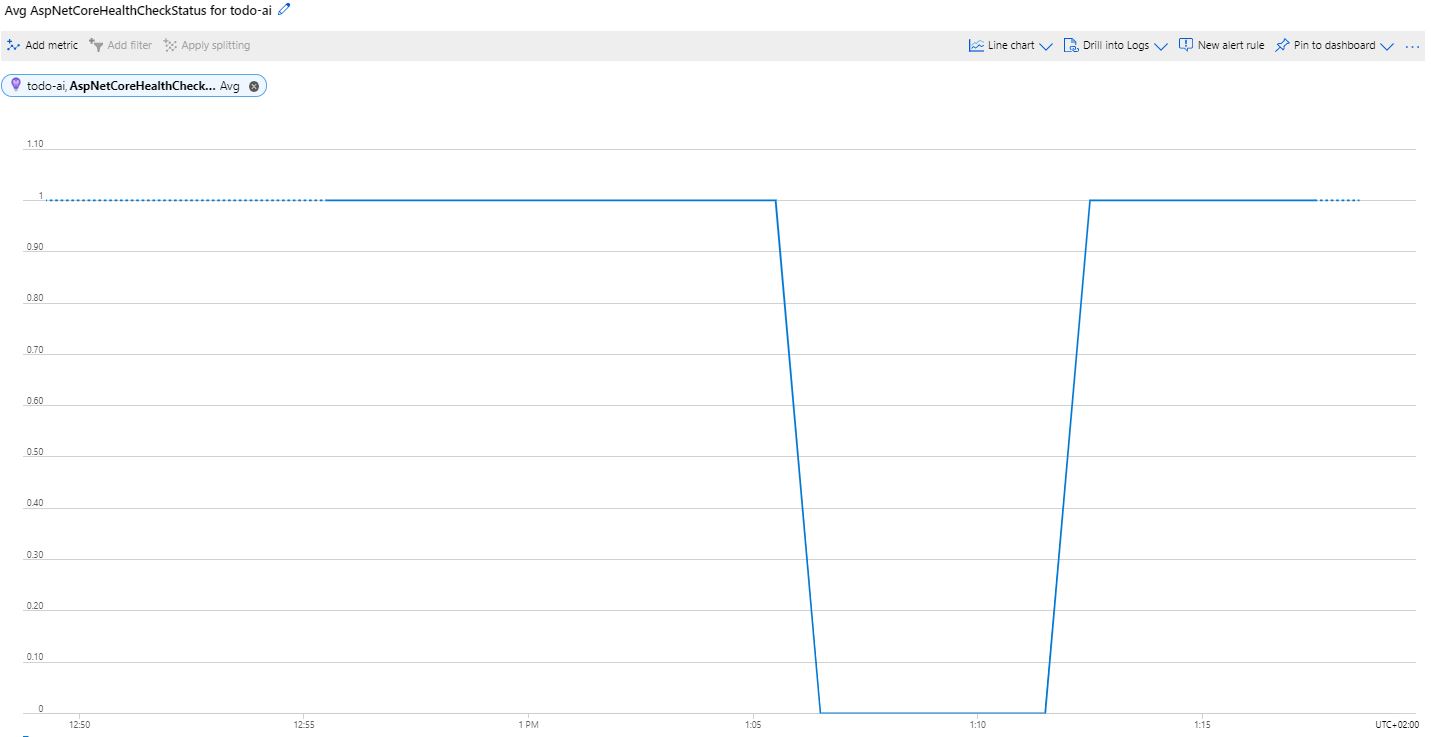 As we can see, we can visualize the availability status of the API according to time periods. So, if we take a look at the graph above, we can see that the API was not available when we stopped the MongoDB instance.
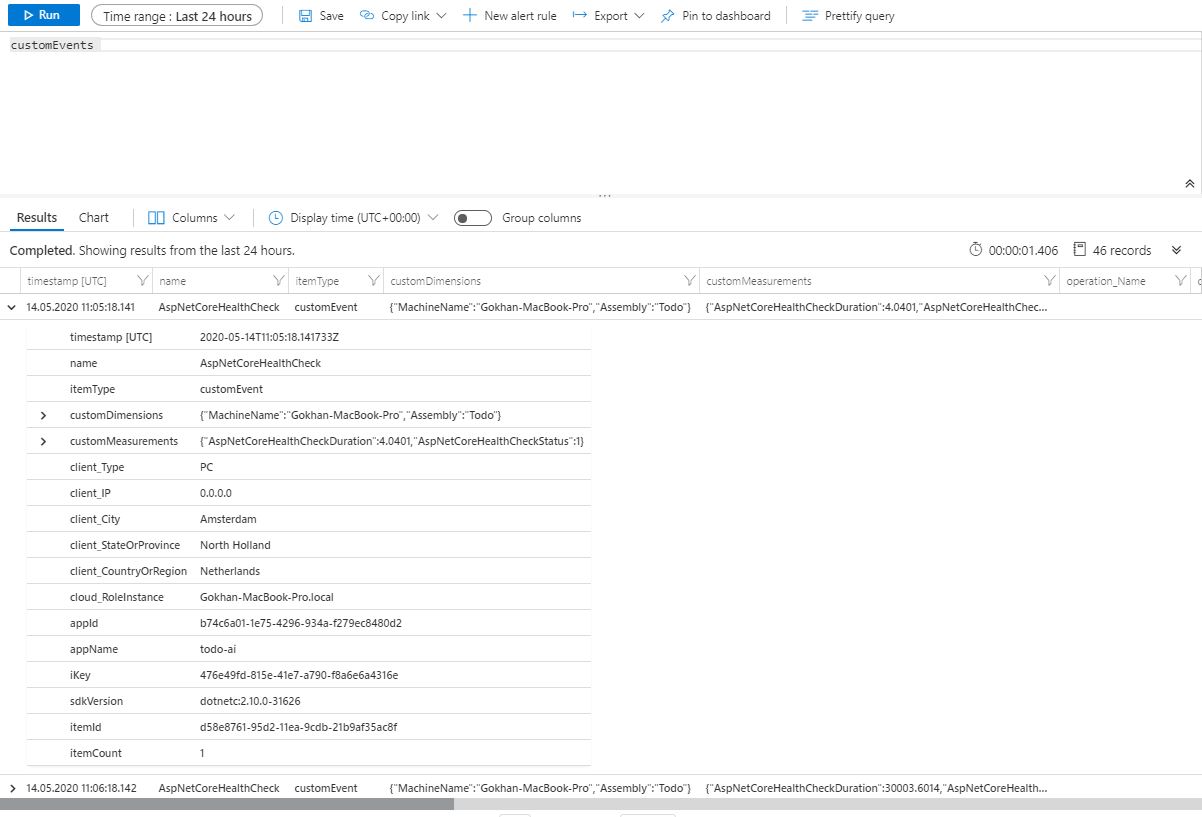
It is also possible to access more detailed health information under the “Monitoring > Logs” tab by creating “customEvents” queries as follows.
Link: https://github.com/GokGokalp/dotnetcore-healthchecks-sample
References
https://docs.microsoft.com/en-us/aspnet/core/host-and-deploy/health-checks?view=aspnetcore-3.1&WT.mc_id=DT-MVP-5003382
https://github.com/Xabaril/AspNetCore.Diagnostics.HealthChecks
Great article for a beginner!
Thank you! 🙂
I have microservices with each one has their own ApplicationInsights setup and healthChecks endpoints.
I have another separate app witch monitors all my endpoints. But now I want to publish applicationInsights combine status to my new AppInsights that is for HealthCheckUI.
Is there any way to summarize all AI with one AI publish just for healthCheck?
Hi, thanks for the comment and sorry for the late reply. If I understand correctly I have never done with that setup before. But just for an idea maybe you could use same AI with all apps and you can distinguish your microservices with OperationName.
Selamlar,
Oncelikle detayli anlatiminiz icin tesekkur ederim. Benim cok temel bir sorum olacak. Bunu .net core ile mi yapmak zorundayiz. Yerli ve yabanci kaynaklara baktigimda sadece .net core ile orneklendirildigini gordum. .net framework ile de yapabilir miyiz?
Merhaba, daha önce .net framework’de kullanmadım bende maalesef. Fakat dependency’lerine baktığımızda nuget.org üzerinden, .net framework 4.6.1 ve üzeri versiyonlarda da kullanılabileceğini görüyorum fakat ne derece uyumluluk sağlar o kısmına yorum yapmak zor maalesef. https://www.nuget.org/packages/Microsoft.Extensions.Diagnostics.HealthChecks/