Code coverage metric is an important indicator of how healthy and reliable our project is, and how quickly we can adapt to changes.
Basically code coverage determines how many of the lines of the code we have written are verified by writing tests. Of course, we are not talking about happy-path test scenarios that we can write just to increase the code coverage metric. Unfortunately the 100% code coverage metric does not mean that we covered all edge cases. For an easily maintainable and sustainable product, we need to cover all functional scenarios as much as possible by writing unit tests in every aspect.
Also having unit tests automatically pushes us for having a clean and loosely coupled codebase. Because if the functionality/method, that we are going to write tests, is pretty big and complex, writing tests also will be just as much challenging and complex as it shouldn’t be.
By having code coverage metrics, we can identify important code blocks that we missed while writing unit tests, and we can cover them as well.
In addition, by determining some code coverage rules within the relevant teams, we can push ourselves to have unit test culture and increase our confidence rates on our projects.
Within the scope of this article, I will briefly try to show how we can calculate code coverage for our .NET applications and how we can integrate it into our Continuous Integration processes on Azure DevOps.
Code Coverage
We will use the coverlet, which is a cross-platform code coverage framework, to calculate code coverage. Also coverlet comes as a default VSTest data collector for .NET Core and .NET 5 xUnit Test projects.
Data collectors perform different monitoring operations such as collecting code coverage metrics during test execution.
All we need to do to collect code coverage metrics is to run the dotnet test process with –collect=”XPlat Code Coverage” parameter.
When I run the above command to collect code coverage metrics on the test project, which you can access here, the coverlet collects metrics in Cobertura format, which is the default format, as follows.

It is also possible to customize the metric collection process by having a file called coverlet.runsettings as follows.
<?xml version="1.0" encoding="utf-8" ?>
<RunSettings>
  <DataCollectionRunSettings>
    <DataCollectors>
      <DataCollector friendlyName="XPlat Code Coverage">
        <Configuration>
          <Format>cobertura</Format>
          <ExcludeByFile>**/MyTodoApp.API/Startup.cs</ExcludeByFile>
        </Configuration>
      </DataCollector>
    </DataCollectors>
  </DataCollectionRunSettings>
</RunSettings>
dotnet test --settings coverlet.runsettingsFor example, with the above configuration, we have ensured that the “Startup.cs” file under the “MyTodoApp.API” folder will not be considered for the code coverage metric and the metric format is in “cobertura” format.
Azure Pipeline
Let’s create a simple pipeline to include code coverage and test results in our CI processes on Azure.
# Starter pipeline
# Start with a minimal pipeline that you can customize to build and deploy your code.
# Add steps that build, run tests, deploy, and more:
# https://aka.ms/yaml

trigger:
- master

pool:
  vmImage: ubuntu-latest

variables:
  testProjectName: 'MyTodoApp.Tests'

steps:
- task: DotNetCoreCLI@2
  displayName: "Run dotnet restore"
  inputs:
    command: 'restore'
    projects: '**/$(testProjectName).csproj'
- task: DotNetCoreCLI@2
  displayName: "Run dotnet test"
  inputs:
    command: 'test'
    projects: '**/$(testProjectName).csproj'
    publishTestResults: false
    arguments: '--settings $(Build.Repository.LocalPath)/$(testProjectName)/coverlet.runsettings --logger trx'
- task: PublishTestResults@2
  displayName: "Publish test results"
  inputs:
    testResultsFormat: 'VSTest'
    testResultsFiles: '$(System.DefaultWorkingDirectory)/$(testProjectName)/TestResults/**/*.trx'
- task: PublishCodeCoverageResults@1
  displayName: "Publish code coverage results"
  inputs:
    codeCoverageTool: 'Cobertura'
    summaryFileLocation: '$(System.DefaultWorkingDirectory)/$(testProjectName)/TestResults/*/coverage.cobertura.xml'
In this pipeline definition,
- task: DotNetCoreCLI@2
  displayName: "Run dotnet test"
  inputs:
    command: 'test'
    projects: '**/$(testProjectName).csproj'
    publishTestResults: false
    arguments: '--settings $(Build.Repository.LocalPath)/$(testProjectName)/coverlet.runsettings --logger trx'
first we “restore” the NuGet packages and then we run the “dotnet test” command with the “coverlet.runsettings” file that we have defined according to the needs of our project. Also, I set the “publishTestResults” parameter to “false” because I don’t want the relevant results to be created in a temp folder in the agent. Thus, the relevant results will be generated in the “TestResults” folder under the project path.
- task: PublishTestResults@2
  displayName: "Publish test results"
  inputs:
    testResultsFormat: 'VSTest'
    testResultsFiles: '$(System.DefaultWorkingDirectory)/$(testProjectName)/TestResults/**/*.trx'
Since we didn’t automatically publish the test results in the previous step, at this step we publish the test results, which will be created under the project path, to Azure Pipeline in “VSTest” format. Thus, we will be able to see the detailed test results through the pipeline.
- task: PublishCodeCoverageResults@1
  displayName: "Publish code coverage results"
  inputs:
    codeCoverageTool: 'Cobertura'
    summaryFileLocation: '$(System.DefaultWorkingDirectory)/$(testProjectName)/TestResults/*/coverage.cobertura.xml'
As a final step, we publish the code coverage results which will be created in cobertura format to Azure Pipeline using the “PublishCodeCoverageResults” task.
That’s all!
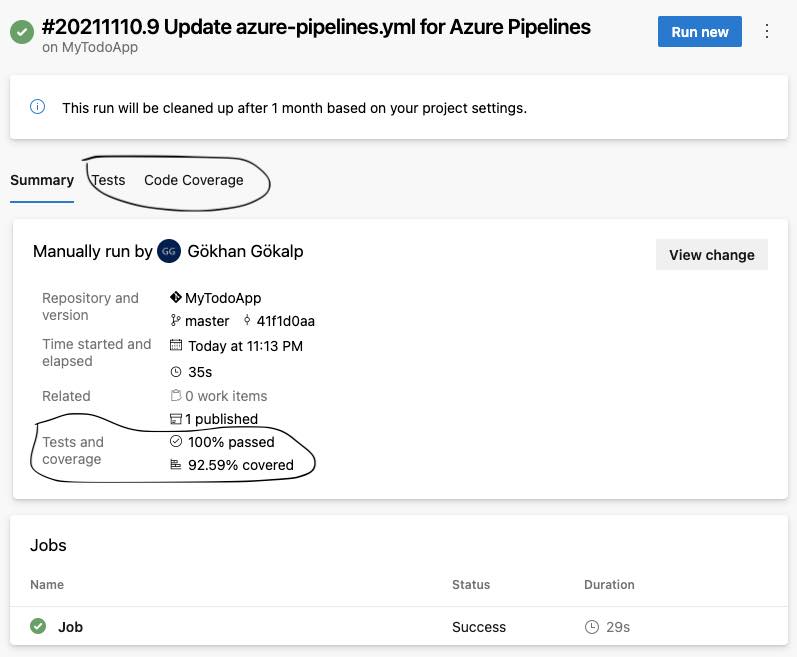
When we run the pipeline, we will be able to take a quick look at the test and coverage information of the project in the Summary section as below.

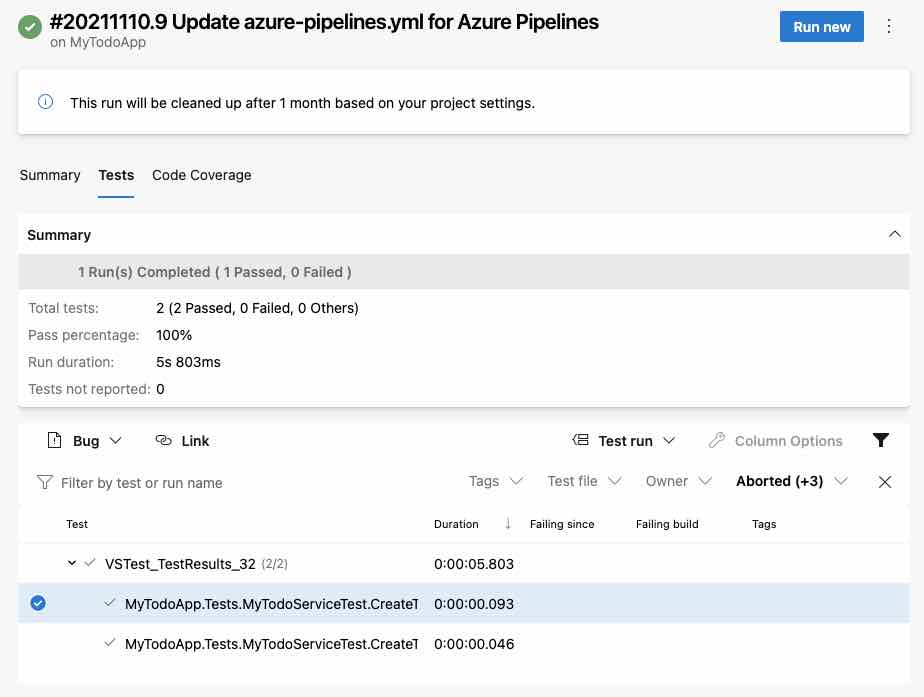
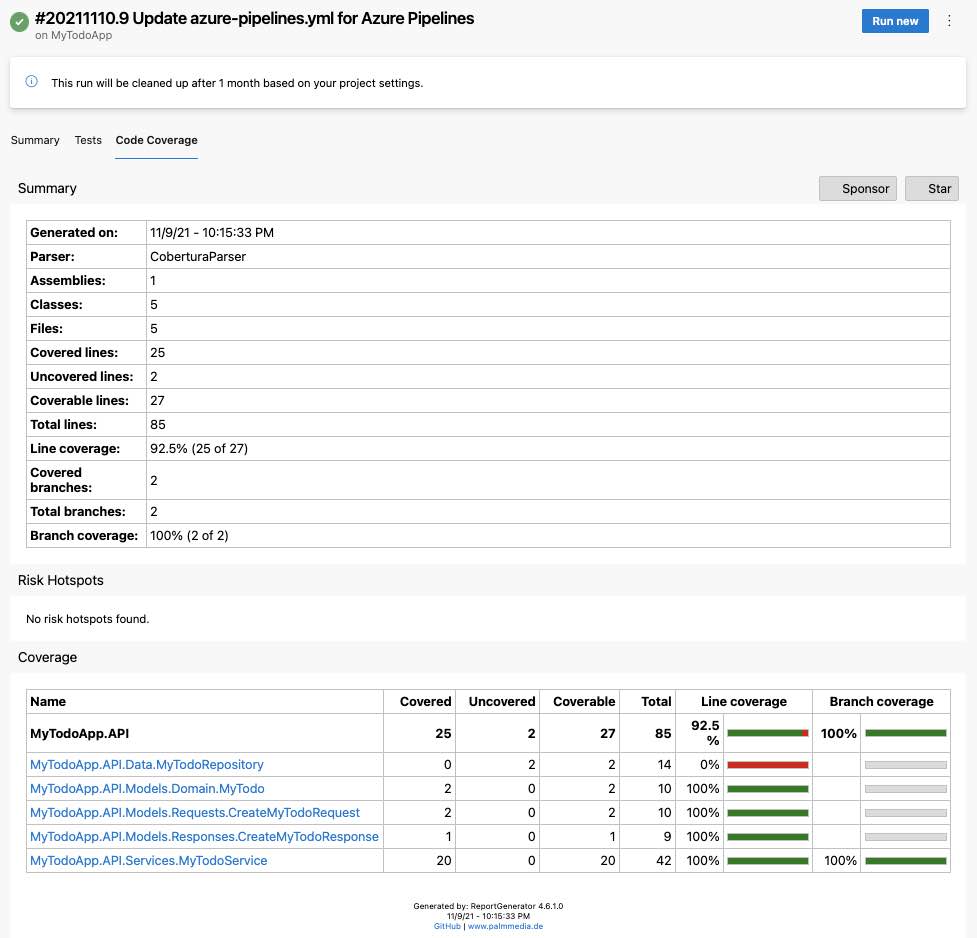
If we want, we can also see more detailed information by clicking on the relevant tabs.


As we can see from the results above, we can see the code coverage we have or in which parts of the application we can have.
Thus, we can easily address the parts that are not well tested or overlooked, and cover them as well. In addition, as a team, we can set a certain code coverage rate as a quality target for ourselves. Thus, while bringing the codebase of the project to a much cleaner point, we can also increase the confidence rates of us on the project.
In order to include the code coverage quality target into the CI process, we can use the Build Quality Checks task.
For example, in order to set a 95% quality rate, we can add a task to the yaml pipeline as following.
- task: BuildQualityChecks@8
  displayName: "Code coverage quality check"
  inputs:
    checkCoverage: true
    coverageFailOption: 'fixed'
    coverageType: 'lines'
    coverageThreshold: '95'
Basically this task decides whether the build crash by looking at the calculated “line coverage” and “threshold” rates.
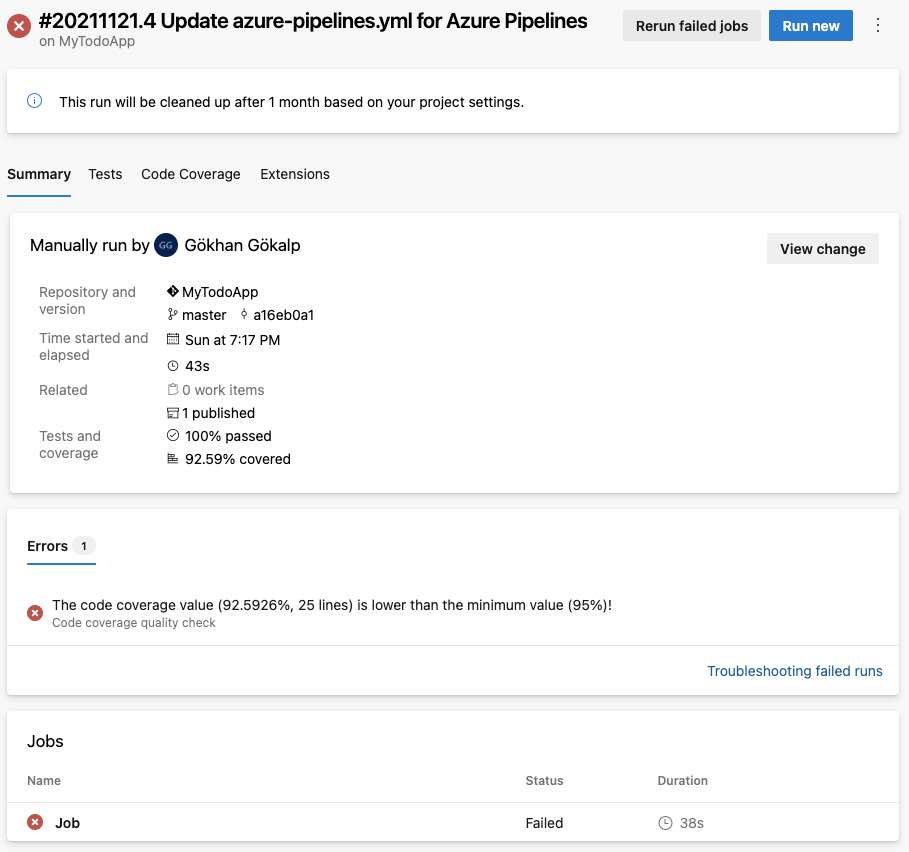
For example,

since the code coverage rate in the test project was below 95%, the build was unsuccessful. Thus, we can push ourselves to write more tests and have a culture within the team and ensure that the codebase is always well tested and clean.
So
The importance of having a code coverage metric is very high in terms of the health of the project and increasing the confidence rate of the team on the project. In order for this confidence rate to be a more realistic, by writing test cases we need to take into account all possible edge cases as much as we can.
In this article, I tried to show how we can collect code coverage metrics with Coverlet and how we can include them into our CI processes on Azure.
Github: https://github.com/GokGokalp/dotnet5codecoverage
References
https://docs.microsoft.com/en-us/azure/devops/pipelines/tasks/test/publish-code-coverage-results?view=azure-devops
https://docs.microsoft.com/en-us/azure/devops/pipelines/tasks/test/publish-test-results?view=azure-devops&tabs=trx%2Cyaml
https://github.com/coverlet-coverage/coverlet/blob/master/Documentation/VSTestIntegration.md


Be First to Comment